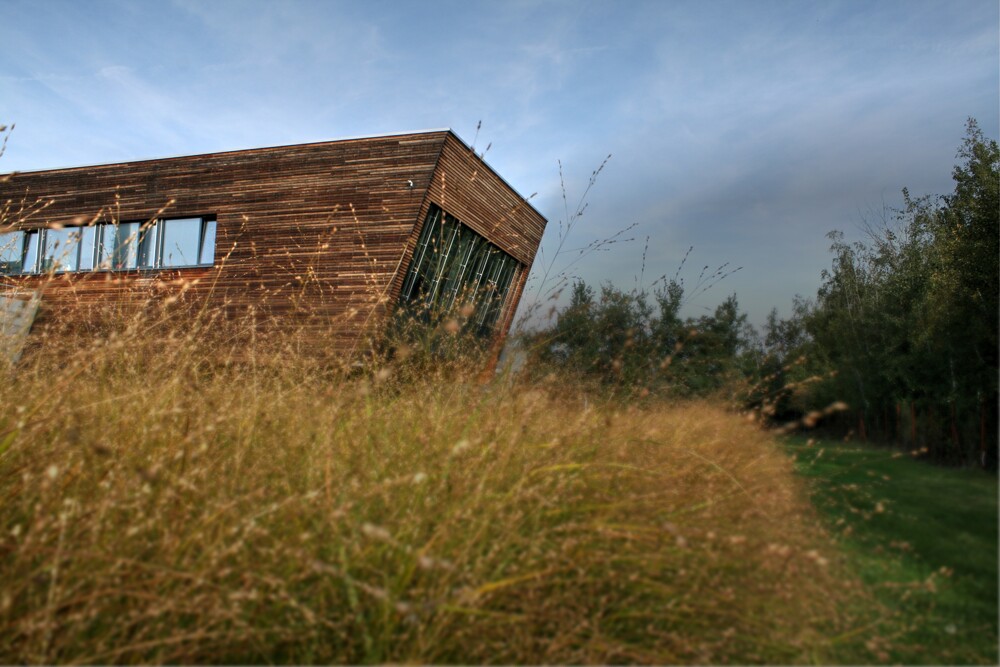
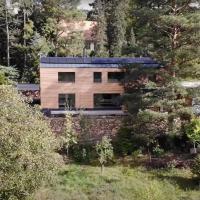
The CTU University Centre for Energy Efficient Buildings has successfully tested a technology that can reduce energy consumption and operating costs while flexibly responding to supply and demand on the energy market. The verification took place in a family house in Omice near Brno, which is used for regular living and as a test object.
The house's energy management system, based on the market price of energy, uses battery storage according to a flexible tariff, within the framework of which the price development in hourly intervals is always given a day in advance. This allows energy to be purchased from the grid when it is cheap. In times when it is more expensive, the consumption is then covered by batteries and photovoltaics. Depending on the price, it is also possible to control heating or cooling to make more use of cheaper energy with only a slight deviation from user settings.
The technology includes three parts focused on the energy system and the environment in the building. The first one controls
the battery storage and regulates the required temperatures in the heated room according to the current price of electricity.
The second part ensures the highest possible utilization of heat gains from activities in the building, which are functionally
independent of the automatically controlled energy system. For this purpose, the influence of flooding in accumulation stoves
for variously distant and connected rooms was assessed. In the third part, zonal control of ventilation to increase air quality
is addressed.
The family house in Omice was created as part of the Centra pokročilých materiálů a efektivních budov (CAMEB) project, which aims to optimize systems of renewable energy sources
for buildings with almost zero consumption (nZEB). In addition to CTU UCEEB, a number of other participants participate in
it, you can learn more about the project in tomto videu.
![[album/Products_Model_Product/1009/Omice_png.png]](https://c.uceeb.cz/images/album/Products_Model_Product/1009/Omice_png.png)